Matplotlib图表 MatplotlibChart
显示Matplotlib图表。
示例
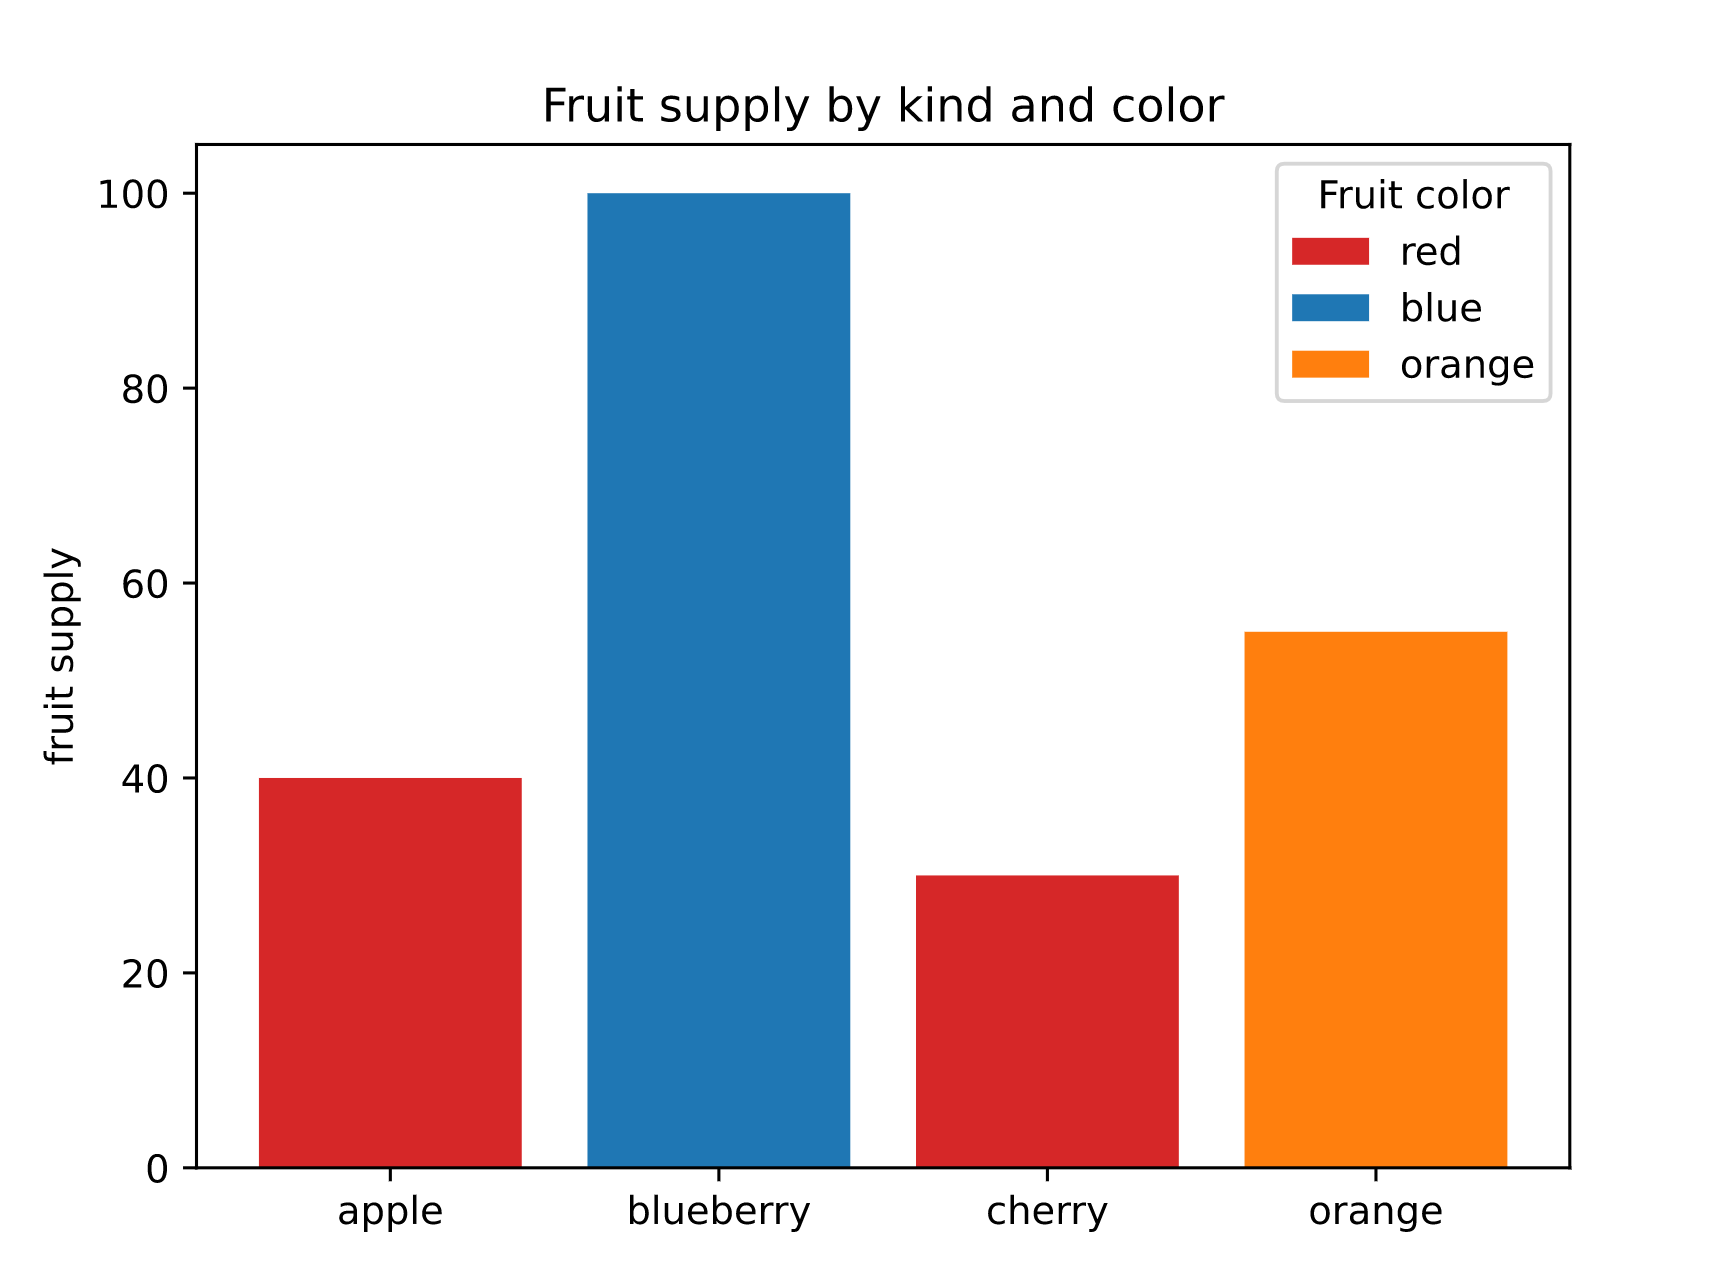
柱状颜色图表
以下示例基于Matplotlib文档中的原始示例。

import matplotlib
import matplotlib.pyplot as plt

import flet as ft
from flet.matplotlib_chart import MatplotlibChart

matplotlib.use("svg")


def main(page: ft.Page):

    fig, ax = plt.subplots()

    fruits = ["apple", "blueberry", "cherry", "orange"]
    counts = [40, 100, 30, 55]
    bar_labels = ["red", "blue", "_red", "orange"]
    bar_colors = ["tab:red", "tab:blue", "tab:red", "tab:orange"]

    ax.bar(fruits, counts, label=bar_labels, color=bar_colors)

    ax.set_ylabel("水果供应")
    ax.set_title("水果种类和颜色的供应")
    ax.legend(title="水果颜色")

    page.add(MatplotlibChart(fig, expand=True))


ft.app(target=main)
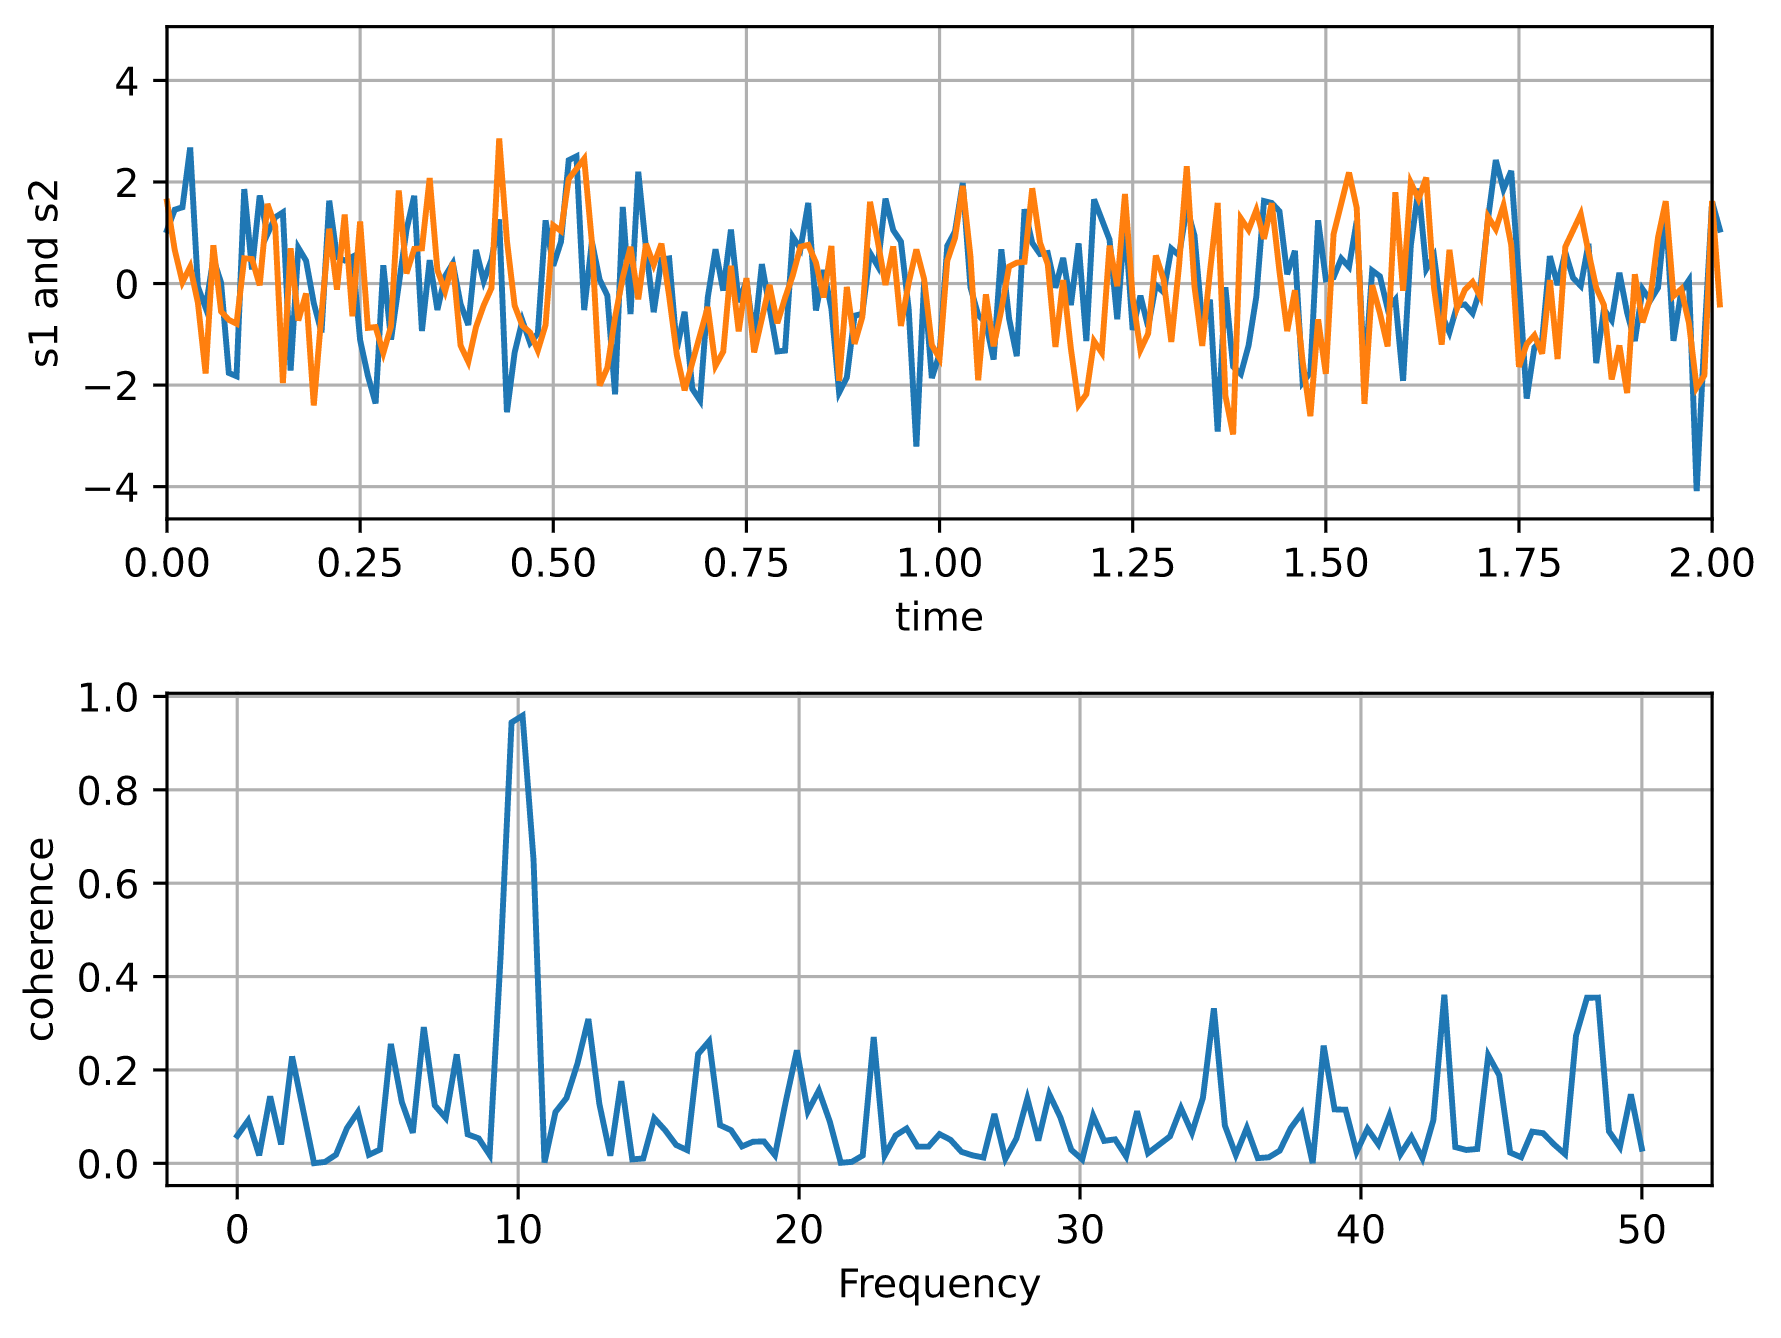
折线图
以下示例基于Matplotlib文档中的原始示例。

import matplotlib
import matplotlib.pyplot as plt
import numpy as np

import flet as ft
from flet.matplotlib_chart import MatplotlibChart

matplotlib.use("svg")

def main(page: ft.Page):

    # 固定随机状态以便重现性
    np.random.seed(19680801)

    dt = 0.01
    t = np.arange(0, 30, dt)
    nse1 = np.random.randn(len(t))  # 白噪声1
    nse2 = np.random.randn(len(t))  # 白噪声2

    # 两个信号,其中一个在10Hz处有一部分相干,另一个是随机的部分
    s1 = np.sin(2 * np.pi * 10 * t) + nse1
    s2 = np.sin(2 * np.pi * 10 * t) + nse2

    fig, axs = plt.subplots(2, 1)
    axs[0].plot(t, s1, t, s2)
    axs[0].set_xlim(0, 2)
    axs[0].set_xlabel("时间")
    axs[0].set_ylabel("s1和s2")
    axs[0].grid(True)

    cxy, f = axs[1].cohere(s1, s2, 256, 1.0 / dt)
    axs[1].set_ylabel("相干性")

    fig.tight_layout()

    page.add(MatplotlibChart(fig, expand=True))

ft.app(target=main)
属性
figure
要绘制的Matplotlib图表 - matplotlib.figure.Figure类的实例。
isolated
每次使用page.update()或Control.update()方法更新页面或父图表控件时,都会通过调用Matplotlib API重新绘制图表。频繁地重新绘制大型图表可能会影响整个Flet应用程序的性能。
将isolated设置为True以启用显式图表更新。要重新绘制图表,请调用其update()方法。例如,本页面上的第一个示例可以修改为以下内容:
def main(page: ft.Page):

    # ...

    # 设置初始坐标轴图例
    ax.legend(title="水果颜色")

    # 启用显式更新
    # 并将图表添加到页面中
    chart1 = MatplotlibChart(fig, isolated=True, expand=True)
    page.add(chart1)

    sleep(5)

    # 更新图表坐标轴
    ax.legend(title="颜色")
    chart1.update()

ft.app(target=main)
original_size
True以显示原始大小的图表。False(默认值)以显示适合配置边界的图表。
transparent
True以去掉图表的背景。False(默认值)以显示带有背景的图表。